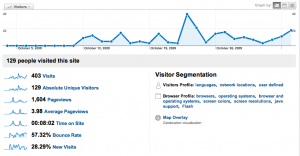
So the results are in. Actually, I’m looking at the numbers a tad bit early, but we have a fairly round number as of today, so it looks all pretty. Anyhow, what I’m talking about is hits to the site. Recorded via Google Analytics, Since October 11th through today, we’ve had a total of 403 visits to the site, with 129 uniques. I’m pretty excited about that, actually. It’s been less than a month and it looks like we’ve managed to grab a good following.
October 23rd seems to have had the highest hit count. That was the night we tested all of the video, so it makes sense. Even if we only have thirty or so people watch the stream during the event and donate $10, that’s not an amount to sneeze at. The way things are looking, though, we’ll at least have more than that viewing the show if these numbers keep escalating.
Also interesting are where these visitors are coming from, both from where they live and from what sites. Most of the traffic is coming from referring sites like Facebook and Twitter. It’s good to know that they have a hand in bringing people around that it’s not just a waste of time using them.
On the map front, it looks like Oklahoma has had the most visitors (makes sense), but there is a wide swath throughout the nation.
And there you have it. It’s been less than a month and I think we’re already rolling pretty well. Let’s keep it up!

